DATA MODELING: Nike Daily Stock Returns [Period: 2007-2016]
Summary: Modeling Volatility in Stock Price Data
One of my most interesting and challenging courses this semester is Applied Financial Modeling. So far, the course has focused on modeling financial data using time-series econometrics. Our most recent project tasked us with modeling the daily and monthly volatility of stocks from three separate industries and the S&P500 index. This requires modeling the stock's mean growth rate and variance using ARMA(p,q) and GARCH(p,q) models, respectively. For brevity, I have only included the results for Nike’s daily returns here.
Methodology:
Tools Used:
Data Analysis: R Markdown
Libraries: stats, zoo, nortest, tseries, moments, forecast, rugarch, FinTS
Data Cleaning:
Differencing the data: Modeling time series assumes stationarity (a constant mean and variance over the entire period). Financial data violates this assumption as stock prices usually increase or decrease over time. We can address this by 'differencing' the data or calculating the difference between Nike’s current stock price and its price one period prior. The graph below shows the daily percentage change in Nike's stock price from 2007 to 2016.
Modeling Nike's Daily Returns:
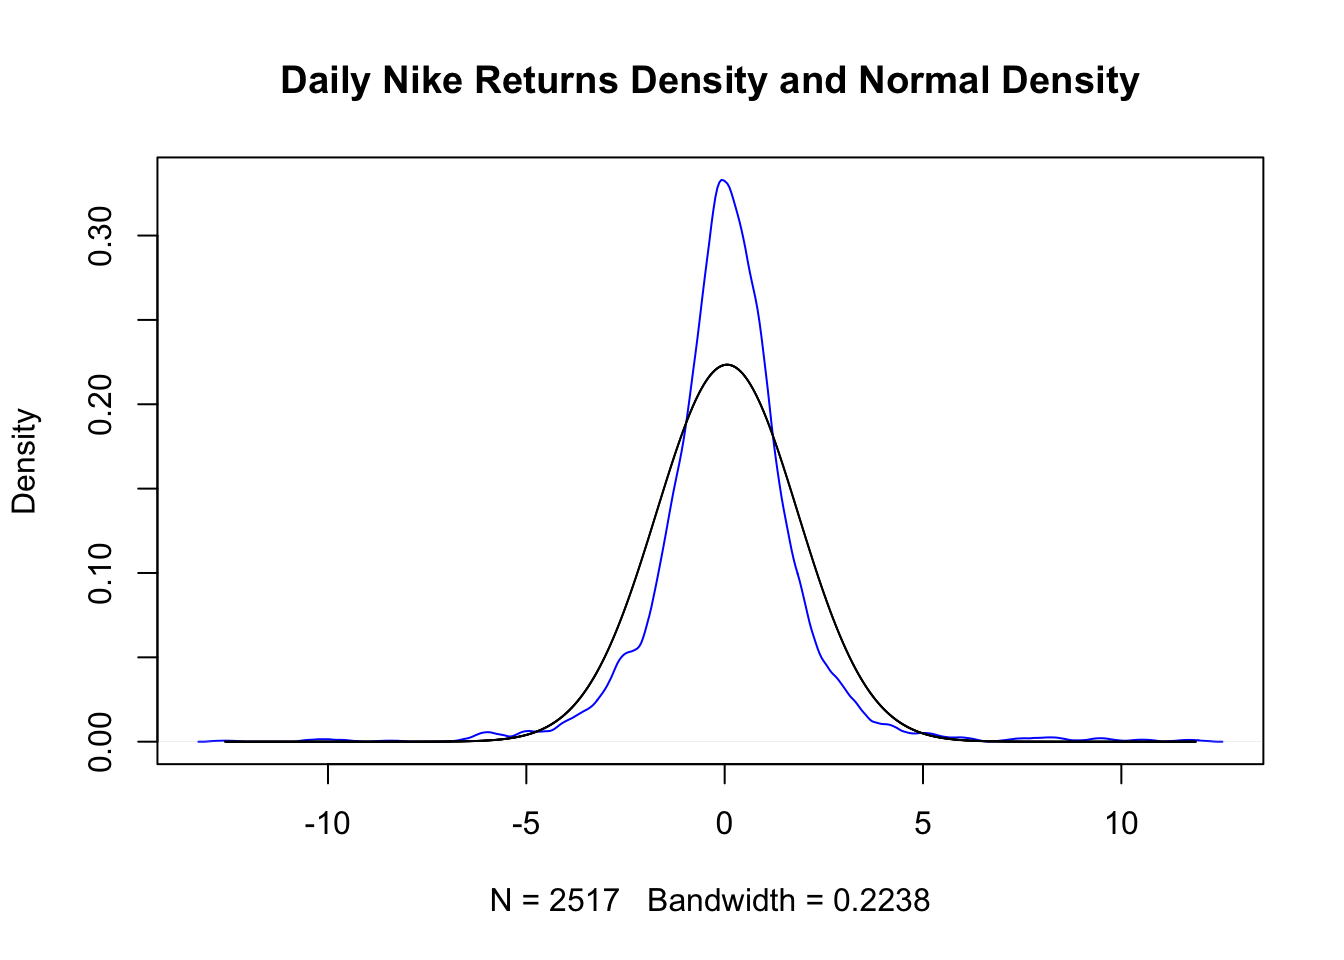
As mentioned above, modeling time-series requires stationarity (constant mean and variance). However, as normality tests and the density plot below indicate, Nike's stock movement clearly does not follow a normal distribution.
To account for Nike's non-constant mean and variance, we can use ARMA(p,q) and ARCH modeling, respectively.
Terms and Models Used:
- ARMA(p,q) [Autoregressive Integrated Moving Average Model] - uses data from previous time-points [AR(p)] and data from previous error terms [MA(q)] to predict the next time-point.
- ARIMA(p,d,q) Model - ARIMA model predicts the difference between the AR(p) and MA(q) models.
- ARCH [Autoregressive Conditional Heteroskedasticity] - occurs when one or more data points in a series has an error term variance that is a function of a previous time period’s error term(s).
- GARCH(p,q) [Generalized ARCH] Model - predicts the difference in the error term. Using an ARIMA(p,q) model requires this model.
Summary Statistics and Analysis :
The tests for autocorrelation unsurprisingly indicate that Nike's daily returns are significantly correlated with its previous daily returns.
The ARIMA(p,q) model indicates that Nike has a mean growth rate of 6.22%. The ARIMA model also fails to establish a predictive relationship for today's returns using the previous daily returns and previous daily error terms [ARMA(p=0,q=0)].
Tests for ARCH indicate that daily return's error term variance is a function of previous time periods' error terms. To account for the relationship in the error term, I trained a GARCH(1,1) model using the ARMA(0,0) model. The GARCH(1,1) indicates that Nike has a mean error term of -2.86% and a variance of 0.9965, which is approximately equal to the var.(norm. dist.) = 1. Tests for normality still fail but as the plot below shows, the error terms follow the normal distribution much more closely than the daily returns without evaluation.
Takeaways:
By using ARIMA(p,q) and GARCH(p,q) modeling to account for the volatility in Nike's daily returns, we have found that Nike's mean growth rate is approximately 6.22%. The Nike daily returns also have an error term mean that is approximately -2.86% with variance that is approximately normal. This means that we can expect Nike's daily returns to grow by 6.22% - 2.86% (subject to a variance of 1) per day.
![DATA MODELING: Nike Daily Stock Returns [Period: 2007-2016]](https://images.squarespace-cdn.com/content/v1/58d84842d482e9953912ab18/1492042771709-RSUVBHZFPV7JZZVK74RN/Nike+Daily+Returns+-+EDF.png)


